| << Previous | Contents | Next >> |
State Departments of Transportation face increasing demands from the public, the media and from legislators to document their performance. Major calls for a performance-based Federal-aid highway program have come from the Government Accountability Office, the National Surface Transportation Policy and Revenue Study Commission, the American Association of State Highway and Transportation Officials (AASHTO) and from the Federal Highway Administration (FHWA).
State and Federal transportation agencies generally embrace these calls for greater accountability and a significant number of State transportation agencies produce extensive performance metrics. Collectively, however, it has been a complex undertaking to find measures that all the State agencies agree upon, and which are uniformly available across all 50 States, the District of Columbia and Puerto Rico.
Although performance measurement is becoming common among State transportation departments, it has been a long-standing practice in the private sector. The lessons of the private sector indicate that measures such as the Asset Sustainability Index play an important performance-measurement role, particularly for capital-intensive organizations. A basic business-finance textbook would include numerous capital-investment metrics that are commonly used to evaluate the health, or sustainability, of a publicly traded company.
These would include metrics such as the Repair and Maintenance Ratio. This metric is directly analogous to the ASI in that it is derived by calculating:
| Repairs and Maintenance Fixed Assets |
= Repair and Maintenance Ratio |
In this calculation the expenditures for repairs and maintenance are tracked over time and compared to the value of the company?s fixed assets, such as buildings, assembly lines or key assets such as railways for a railroad. Failure to invest adequately in this type of critical equipment will lead to future financial liability as unaddressed repairs accumulate creating higher future costs. In addition, the "book value" of the company declines because its assets are degraded and financially less valuable. Third, the reliability of the company decreases with aging infrastructure. In short, the Repair and Maintenance Ratio would be a common metric for a private-sector business.
Similarly, a Maintenance and Repair Index would roll up or combine several categories of asset types. A Repair and Maintenance Ratio could be calculated for various categories such as buildings, rolling stock, manufacturing equipment, foundries or other asset types. This index could include calculations such as:
| Labor, Equipment to Maintain Assets Total Labor and Equipment Costs |
= Maintenence and Repair Index |
Tracked over time the Maintenance and Repair Index could provide insight in at least three areas. First, if maintenance costs continue to rise, it can indicate that aging equipment is consuming disproportionate resources. A lack of adequate investment could indicate future performance problems. Third, the index could indicate that certain assets within the company are not receiving adequate maintenance.
Several types of Fixed Asset Ratios are commonly used in private sector finance with each ratio providing different types of insight. When the value of fixed assets is divided by debt, the ratio provides insight into whether the company has incurred excessive debt to sustain its fixed assets.
| Fixed Assets Short or Long-term Debt |
= Fixed Assets to Debt Ratio |
Another calculation indicates whether the company's fixed assets are increasing or decreasing compared to the company's net equity.
| Fixed Assets Net Equity |
= Fixed Asset Ratio |
A change over time in this ratio could indicate whether the important physical assets of a company are increasing or decreasing. By itself, this change may not be of concern unless it indicates that the company has too much capital tied up in illiquid physical assets.
The Class I railroads provide an analogous reporting example to transportation departments. Like transportation departments, railroads are capital intensive and their primary product is to provide mobility. While transportation departments are under scrutiny from the public and legislators, the railroads are under intense public scrutiny from investors, who are provided significant disclosure by reporting requirements of the Securities and Exchange Commission (SEC). Railroads and other publicly traded companies must provide annual reports and other disclosures that allow investors to understand the performance of the company, and how it invests the company?s resources, which are actually owned by millions of shareholders.
For railroads, performance data necessary to calculate asset-investment measures are reported. For instance in the 2010 annual report of the Norfolk Southern Railroad, the degree and adequacy of its capital investment are among the key metrics presented.
| 2011 | 2010 | 2009 | 2008 | 2007 | 2006 | |
|---|---|---|---|---|---|---|
| Total Assets | $28,199 | $27,369 | $26,297 | $26,144 | $26,028 | |
| Operating Revenues | $9,516 | $7,969 | $10,661 | $9,432 | $9,407 | |
| Net Income | $1,496 | $1,034 | $1,716 | $1,464 | $1,481 | |
| Capital Expenditures | $2,200* | $1,470 | $1,299 | $1,558 | $1,341 | $1,178 |
| *estimated | Source: 2010 NSF RR annual report (all figures are in millions) | |||||
The capital expenditures on track, railcars, locomotives and other long-term assets grew 25 percent over the preceding five years. They are predicted to rise to $2.2 billion for 2011, which would be an 87 percent increase compared to 2006. The amount spent on capital ranges between 80 percent and 120 percent of the company?s net income or profit. The insight such metrics provide to investors is to inform them whether the company is sustaining its critical assets for long-term viability. On paper, the company could nearly double its net income or profits in the short-term by cutting its capital investments. However, such a short-term move would not translate into higher stock prices because investors could see that the long-term viability of the company was sacrificed. The condition of track, locomotives, switches, dispatching computers and radios are key components of rail?s reliability. Without high reliability ratios, the railroad would lose market share to trucking or other competitors. In short, the adequacy of capital investment to ensure their long-term viability is a key railroad performance metric valued by investors.
Norfolk Southern breaks down its capital investments to provide important granularity for stock analysts and investors. These expenditures include both capital investments and maintenance activities such as maintaining the rail surfaces, replacing ties and investing in rolling stock. For instance, the railroad has the following miles of track: (See Table 4)
| Miles of Road | Second Tracks | Passing, Crossover | Yards and Switching | Total |
|---|---|---|---|---|
| 20,183 | 4,663 | 2,382 | 9,121 | 36,349 |
It reports its maintenance and investments on these railways to be: (See Table 5)
| 2010 | 2009 | 2008 | 2007 | 2006 | |
|---|---|---|---|---|---|
| Track miles installed | 422 | 434 | 459 | 401 | 327 |
| Track miles resurfaced | 5,326 | 5,568 | 5,209 | 5,014 | 4,871 |
| New crossties installed | 2,600,000 | 2,700,000 | 2,700,000 | 2,700,000 | 2,700,000 |
As can be seen, an average of 5,000 miles of track is resurfaced annually. Resurfacing consists of maintaining and adjusting rails and ties to be level and parallel which prevents derailments and other problems. A steady and predictable amount of preservation and maintenance of track surface and ties is regularly set aside from the company?s finances. With 36,349 miles of track, 9,121 are for very low-speed switching yards, while another 27,220 are for mainline and sidings. Of those, the more than 5,000 miles of resurfacing annually means that every mainline mile would be resurfaced approximately every 5.1 years.
For rolling stock, the railroad reports the following average ages: (See Table 6)
| 2010 | 2009 | 2008 | 2007 | 2006 | |
|---|---|---|---|---|---|
| Freight Cars | 31.0 | 30.3 | 29.9 | 30.1 | 30.0 |
| Locomotives | 20.5 | 19.9 | 18.9 | 18.1 | 17.7 |
| Retired Locomotives | 28.4 | 31.2 | 34.4 | 30.0 | 35.0 |
These indicate that while its rolling stock is aging from the 2006 averages, it is retiring old locomotives sooner and getting them out of service. With the railroad consuming 440 million gallons of diesel fuel, the efficiency of locomotives is a significant expense.
In 2009, famous investor Warren Buffet of the Berkshire Hathaway, Inc. holding company made the largest single investment ever for the company when he purchased the outstanding shares of BNSF Railway for $34 billion. In his annual letter to shareholders in 2010, Buffet said he was attracted to BNSF as a long-term investment because of likely long-term economic growth that will increase freight volume, of which BNSF moves approximately 11 percent of all intercity ton miles. He also noted that the BNSF will remain profitable and attractive if Berkshire Hathaway continues the substantial infrastructure investment in BNSF that has made the company successful in recent decades. He referred to the "social compact" Berkshire Hathaway has with society to continue sustaining the infrastructure of this important railroad, and other holdings such as its utility companies.
"All of this adds up to a huge responsibility," he wrote in his shareholders letter. "We are a major and essential part of the American economy?s circulatory system, obliged to constantly maintain and improve our 23,000 miles of track along with its ancillary bridges, tunnels, engines and cars. In carrying out this job, we must anticipate society?s needs, not merely react to them. Fulfilling our societal obligation, we will regularly spend far more than our depreciation, with this excess amounting to $2 billion in 2011. I?m confident we will earn appropriate returns on our huge incremental investments. Wise regulation and wise investment are two sides of the same coin."
In its final company annual report before being bought by Berkshire Hathaway, BNSF reported that its total capital expenditures had risen significantly over the past five years, resulting in unprecedented system efficiencies. It reported: (See Table 7)
| 2009 | 2008 | 2007 | 2006 | 2005 | 2004 | |
|---|---|---|---|---|---|---|
| Revenues | $18,018 | $15,802 | $14,985 | $12,987 | $10,946 | |
| Net Income | $2,115 | $1,829 | $1,889 | $1,534 | $805 | |
| Total Assets | $36,403 | $33,583 | $31,797 | $30,436 | $29,023 | |
| Capital Expenditures | $2,800* | $2,175 | $2,248 | $2,014 | $1,750 | $1,527 |
| *estimated | Source: BNSF 2008 annual report | |||||
Like Norfolk Southern, it reported consistently growing investments in basic capital repair and maintenance including: (See Table 8)
| 2008 | 2007 | 2006 | |
|---|---|---|---|
| Rail | $429 | $376 | $304 |
| Ties | $358 | $316 | $311 |
| Surfacing | $230 | $235 | $214 |
| Signals, bridges, right of way improvements | $544 | $432 | $397 |
| Total Engineering | $1,561 | $1,359 | $1,226 |
| Mechanical | $168 | $141 | $152 |
| Other | $133 | $105 | $121 |
| Total Replacement Capital | $1,882 | $1,605 | $1,499 |
| Information Services | $83 | $75 | $65 |
| New locomotive, freight cars* | $8 | - | - |
| Terminal and line expansion | $222 | $568 | $450 |
| Total | $2,175 | $2,248 | $2,014 |
| (all figures in thousands) | |||
| * (leasing and other acquisition strategies reduce this capital item) | |||
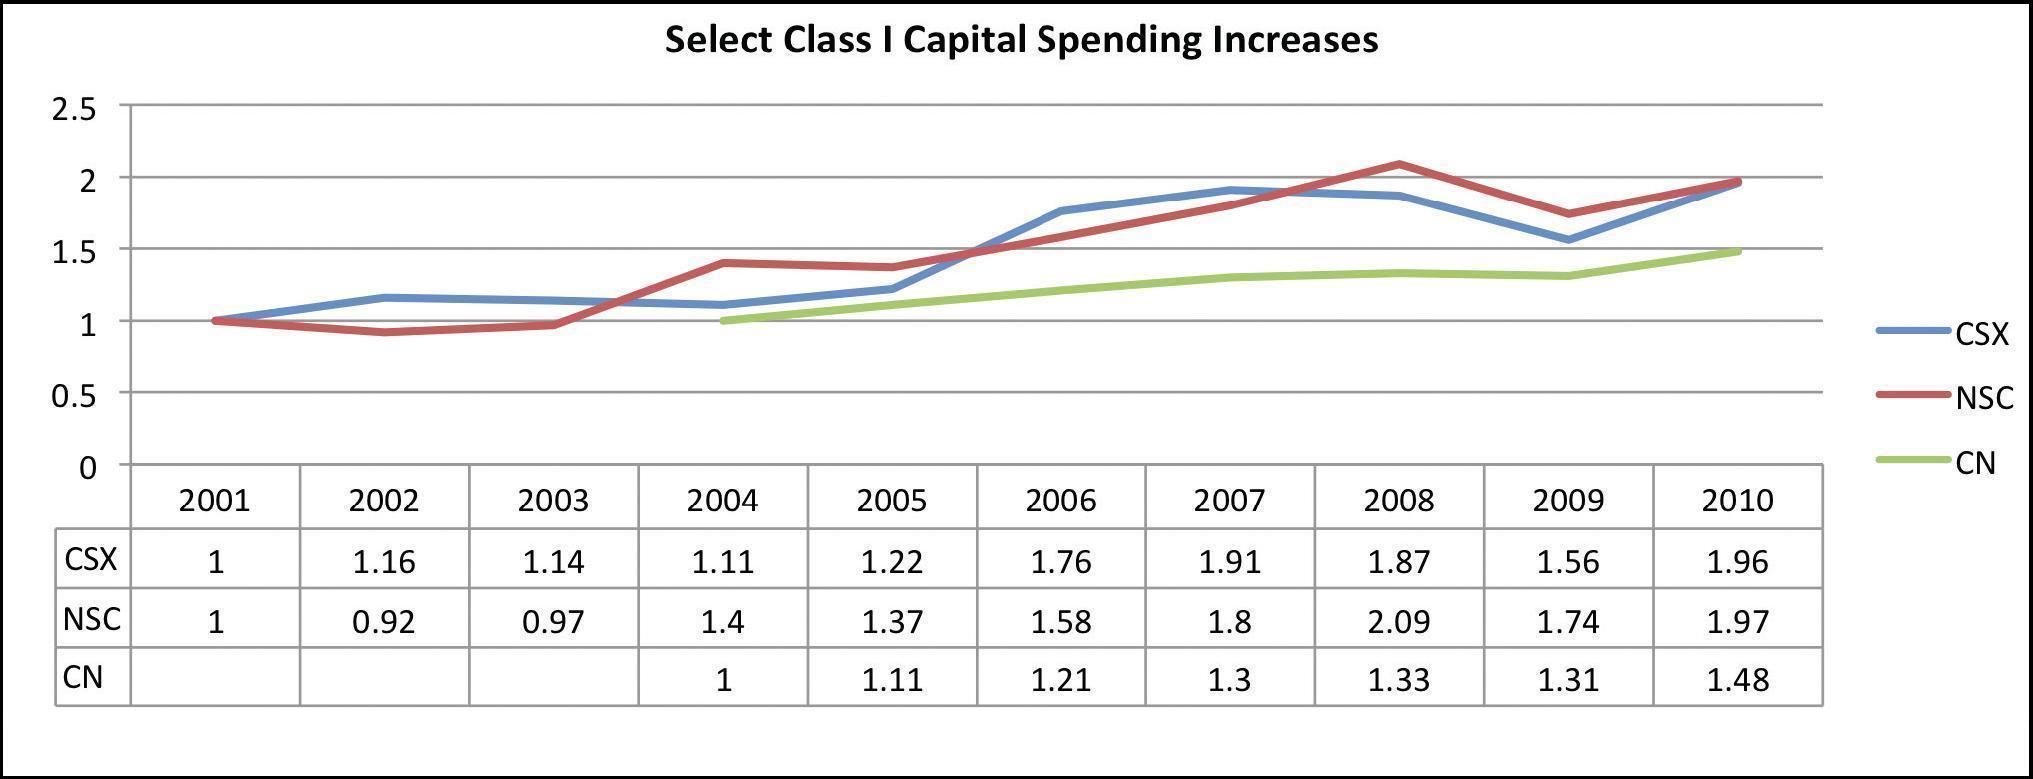
The degree of investment over time by railroads is reported as one of the major metrics by stock analysts, including the Morningstar service. As seen in Figure 11, the overall capital spending on track and equipment for Norfolk Southern, CSX railroad and Canadian National has steadily increased.
Figure 11: Class I capital investment growth.
The private sector?s use of performance metrics significantly predates their use in the public sector and generations of private-sector authors have critiqued the value of various performance metrics. In 1991, the Balanced Scorecard was proposed by two authors (Norton and Kaplan) as a way to improve managers? decision making. The Balanced Scorecard addresses the need to balance competing objectives whenever decisions are made, or when performance metrics are reviewed. For instance, a company wants to be profitable but not to the point that it overcharges customers and cuts quality, which long-term would endanger the firm?s success. The Balanced Scorecard provides managers with sets of performance metrics that allow them to balance competing interests and to "chose a happy medium" between competing objectives.
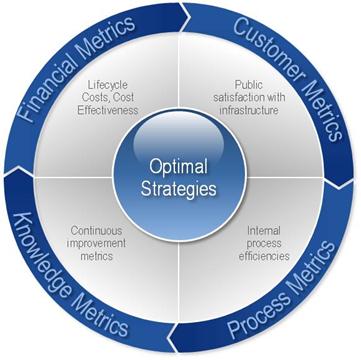
Measures such as the ASI and its related ratios would have private sector analogies within a Balanced Scorecard approach. Four major areas of performance are reviewed and considered within a Balance Scorecard including financial performance, internal process performance, learning and growth and customer satisfaction. An organization would need to balance performance within all four areas, and not just one or two of them, to be successful for the long term. For instance in an infrastructure analogy, a performance measure from the International Roughness Index (IRI) would be very important from the customer perspective because the performance measure directly relates to ride quality. However, from a long-term Transportation Asset Management approach focusing maintenance strategies only on IRI can lead to lack of focus on strategies such as preventive maintenance, rehabilitation or reconstruction. Over time, a focus only on IRI does not necessarily lead to the lowest-lifecycle-cost approach which is a critical financial performance metric.
The financial metrics often used in a Balanced Scorecard relate to short-term issues such as company profitability but also to long-term issues such as financial sustainability. An Asset Sustainability Index directly relates to such long-term financial health metrics. Metrics that only evaluate current and past pavement or bridge conditions are inherently lagging metrics. An Asset Sustainability Index is a leading index and provides insight into likely future outcomes of current decisions.
The Balanced Scorecard has some similarities to the Triple Bottom Line approach. It originated in the 1990s and addressed measuring organizational performance based on "profits, people and planet". For a private sector organization, it would mean measuring the company?s profitability but also its impact on its community and employees, as well as its impact environmentally. Some public-sector organizations have adopted the triple bottom line by measuring their impact environmentally, upon communities and by measuring their long-term fiscal sustainability. An organization that is not financially sustainable creates future liability for its stakeholders. Measures such as the ASI and ASR lend insight into the long-term sustainability of asset investment.
With some similarities to the Balanced Scorecard is the Triple Bottom Line approach. It originated in the 1990s and addressed measuring organizational performance based on "profits, people and planet." For a private sector organization, it would mean measuring the company's profitability but also its impact on its community and employees, as well as its impact environmentally. Some public-sector organizations have adopted the triple bottom line by measuring their impact environmentally, upon communities and by measuring their long-term fiscal sustainability. An organization that is not financially sustainable creates future liability for its stakeholders. Measures such as the ASI and ASR lend insight into the long-term sustainability of asset investment.
Figure 12: The Balanced Scorecard.
Mature performance management systems such as those used by railroads include asset-investment metrics analogous to the Asset Sustainability Index. Also, advancements in performance measurement systems such as the Balanced Scorecard and Triple Bottom Line focus upon fiscal sustainability as a key consideration. As U.S. highway agency performance measurement matures, measures such as the ASI can help them evaluate not only short-term, lagging performance, but can also provide them a leading indicator of likely future performance.
| << Previous | Contents | Next >> |