| << Previous | Contents | Next >> |
The Asset Sustainability Index provides a few critical measures that summarize the long-term trends facing the transportation system while also allowing "drilling down" into the details of how various asset classes will perform into the future. As a result, inherent in the sustainability metrics is a "nested" series of measures from the most summarized down to the most granular that illustrate specific asset classes, even down to the regional level.
This section will discuss how the Asset Sustainability Index is assembled from the various components. Chapter 10 will discuss further how the summarization and the granularity can help illustrate important aspects of transportation system need.
With the Asset Sustainability Index comprising the ratios of pavement, bridge and roadway maintenance, the concept of how to compile them into a composite index is relatively straightforward. The values of the three major ratios are combined and a weighted index is computed.
A simple, theoretical example is shown in Table 35. The amount needed for pavement investment is $500 million, the needed amount for bridges is $250 million and the roadway maintenance need is $225 million. Each is shown as one year's component of a 10-year asset management plan to sustain the assets over the 10-year horizon. Each of the three has a different Sustainability Ratio, with maintenance and bridges receiving a higher percentage of their overall need than do pavements. The weighted sustainability index is the simple weighted average of the three Sustainability Ratios combined into one overall Sustainability Index. In this example, the Sustainability Index for this one year is .88.
It reports its maintenance and investments on these railways (see Table 5).
| Budgeted Investment | Needed Investment | Calculation | Sustainability Ratio | Sustainability Index | |
|---|---|---|---|---|---|
| Pavement | $415 | $500 | $415/500 | 0.83 | |
| Bridge | $225 | $250 | $225/250 | 0.90 | |
| Maintenance | $214 | $225 | $214/$225 | 0.95 | |
| Total | $854 | $975 | $854/$975 | 0.88 | |
| Millions$ | |||||
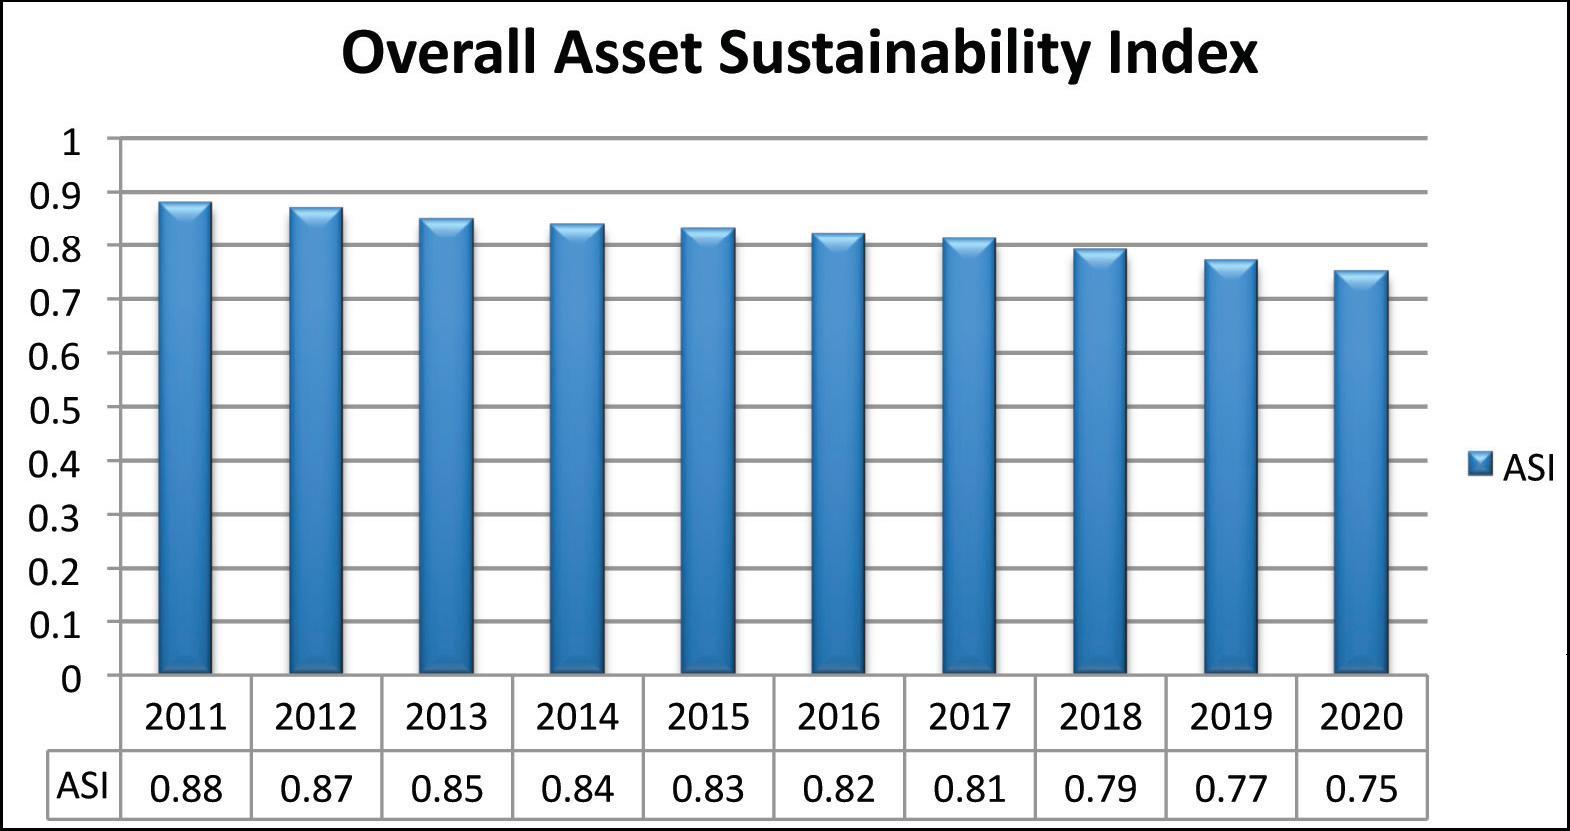
Figure 68 illustrates how the insight provided by the ASI increases when placed in a time series. Any individual year's index provides only limited insight but the decade-long trend line provides insight into the consequences over time.
Figure 68: ASI over time.
Figure 68 conveys the overall trend that statewide investments are inadequate and the current level of investment does not lead to sustainable highway assets over the long term. It also shows that by 2020 investment is only 75 percent of need, which illustrate the approximate magnitude of needed additional investment.
An image such as Figure 68 can be added to key planning and budgeting documents to provide one, comprehensive metric that summarizes the direction in which the highway conditions are heading if current spending continues. The ASI also illustrates the magnitude of needed additional investment. Research such as the National Cooperative Highway Research Program 14-34 Communicating the Value of Highway System Maintenance and Preservation is examining the struggle that highway agencies have in reaching stakeholders with understandable, yet convincing, information about the need for investment. Most transportation management systems produce credible reports but ones which are developed for well-informed and highly trained transportation practitioners. Converting management system information into formats useful for lay audiences is a continuing challenge. Data such as International Roughness Index scales or descriptions of bridge functional obsolescence have proven difficult to explain to the media and others.
The index also can help satisfy calls for accountability and performance measurement. To date, most highway condition performance measures have been narrowly focused upon specific assets, or even only characteristics of specific assets. IRI measures provide insight into pavement roughness, but not into pavement structure, skid quality or remaining service life. Likewise, a bridge may be rated structurally "fair" today but may be on the verge of decline into a "poor" rating that creates need for imminent investment. Providing metrics about these individual characteristics yields insight into condition performance, but only for narrow components of the highway network, and generally only for current conditions. The ASI provides an overall picture for whether the asset management needs for the system as a whole are being adequately addressed.
As a composite metric, the ASI sits at the apex of a comprehensive asset management analysis. It summarizes in one metric the adequacy of investment necessary to sustain highway infrastructure conditions for future users.
Because the ASI is a "condensed" measure, it also allows for the disaggregation or the "drilling into" of its components for greater understanding as to the consequences of under-investment. As the components of the ASI are examined, it is possible to understand which assets are under-funded, and by how much. The final ASI is actually the weighted average of a series of component sustainability ratios each braided into a composite. Each strand can be examined separately to illustrate the trade-offs that have been made and the consequences of them. The granularity that the detailed analysis provides allows decision makers to understand how to calibrate additional investment to achieve very specific results - those results being an adequately funded highway program that sustains all asset classes at a steady state of acceptable conditions.
Nearly every highway agency in the United States today faces serious unmet needs. Officials in these agencies make difficult tradeoffs to allow some assets to decline in condition so that they can focus investments on even more pressing needs. Such tradeoffs were evident in the Minnesota and Utah examples where officials in both States reluctantly decided to allow rural pavement conditions to decline in order to sustain conditions on higher functional classes. The granularity of the ASI allows for the drilling into its components to illustrate which asset classes are being underfunded and by approximately how much.
In the case studies of Utah, Ohio, North Carolina and Minnesota, considerable time was spent illustrating sustainability ratios for critical asset classes such as guardrail, pavement markings or rural pavement conditions. These individual asset classes represent a minority of overall spending but are very important individually. Items such as guardrail or pavement markings contribute disproportionately to highway safety. Their importance can belie the relatively small percentage they consume of the agency's overall spending.
In the hypothetical case shown in Table 35 the maintenance sustainability ratio is .95, indicating that most maintenance needs are addressed. However, if within that overall maintenance calculation key components such as guardrail or pavements markings are underfunded and deteriorating, key public safety and infrastructure trends could go unreported. Likewise, the case studies of both Utah and Minnesota illustrated that rural pavement conditions are likely to significantly deteriorate as scarce resources are prioritized for higher value assets such as the Interstate Highway System or bridges. In Ohio's case, inordinately high bridge deficiencies within districts were observed even though statewide average conditions met targets.
Table 36 from the NCDOT case study illustrates how that DOT has determined need with significant granularity for its bridge maintenance activities. This determination of need can be compared to budgeted amounts per item to produce significant insight into which categories of bridge needs are being adequately met, and which are not. With such granularity, overall decision making and public reporting can be improved. Also, such granularity can be used to prioritize where additional investment is most needed.
| Performance Based Activities | 2011-12 | 2012-13 | 2013-14 | 2014-15 | 2015-16 | 2016-17 | 2017-18 |
|---|---|---|---|---|---|---|---|
| Pavements | $299.03 | $311.59 | $324.68 | $338.31 | $352.52 | $367.33 | $382.76 |
| Shoulders & Ditches | $63.19 | $65.84 | $68.61 | $71.49 | $74.49 | $77.62 | $80.88 |
| Drainage | $39.13 | $40.77 | $42.49 | $44.27 | $46.13 | $48.07 | $50.09 |
| Roadside Appurtances | $9.23 | $9.62 | $10.02 | $10.44 | $10.88 | $11.34 | $11.81 |
| Traffic Control Devices | $40.08 | $41.76 | $43.52 | $45.35 | $47.25 | $49.23 | $51.30 |
| Roadside/Environmental | $103.01 | $107.34 | $111.84 | $116.54 | $121.44 | $126.54 | $131.85 |
| Rest Area/Welcome Center Maint | $11.70 | $12.19 | $12.70 | $13.24 | $13.79 | $14.37 | $14.98 |
| Plant Bed Maintenance | $5.07 | $5.28 | $5.50 | $5.74 | $5.98 | $6.23 | $6.49 |
| Total | $570.44 | $594.40 | $619.36 | $645.38 | $672.48 | $700.73 | $730.16 |
Similar granularity was apparent from the other States, as well. Utah displayed considerable detail by individual class of maintenance asset, further disaggregated by region. Ohio detailed bridge condition deficiencies by category, by district and by year. The granularity of the modern management systems allows the agencies to convey to policy makers the trade-offs faced when investment levels are inadequate and which asset classes must be allowed to deteriorate in order to put resources into even more acute areas.
Table 37 illustrates how the information from the hypothetical scenario in Table 35 can be portrayed with greater granularity to clarify which assets classes are most adequately funded and which are the least. As can been seen in Table 37, the major categories of Pavements, Bridges and Maintenance are further broken into sub-categories by major asset class. The sustainability ratios of the individual classes are shown, and are aggregated in the bottom line into an Asset Sustainability Index for this hypothetical roadway network. The tradeoffs made by the highway agency are clear with the color coding. Green cells indicate adequate investment rations while ones in red indicate the degree of underfunding. In this scenario, Pavement Rehabilitation and Replacement is underfunded acutely throughout the forecast period. Asset classes of resurfacing of major routes, bridge sub and superstructure repair, bridge preventive maintenance and bridge decks are scheduled for significant declines in investment levels as compared to their needs.
Although Table 37 is theoretical, it very closely approximates the type of analysis that was "teased out" of the data from the transportation departments in Utah, Minnesota, Ohio and North Carolina. An actual analysis that resembled Table 37 would give a policy-maker an at-a-glance summation of the adequacy of investment by major asset class for each year of the next decade.
| 2011 | 2012 | 2013 | 2014 | 2015 | 2016 | 2017 | 2018 | 2019 | 2020 | |
|---|---|---|---|---|---|---|---|---|---|---|
| Pavements | 0.83 | 0.82 | 0.81 | 0.81 | 0.80 | 0.79 | 0.78 | 0.77 | 0.77 | 0.76 |
| Major Routes | 0.80 | 0.79 | 0.78 | 0.78 | 0.77 | 0.76 | 0.75 | 0.75 | 0.74 | 0.73 |
| Arterials | 1.00 | 0.99 | 0.98 | 0.97 | 0.96 | 0.95 | 0.94 | 0.93 | 0.92 | 0.91 |
| Collectors | 1.00 | 0.99 | 0.98 | 0.97 | 0.96 | 0.95 | 0.94 | 0.93 | 0.92 | 0.91 |
| Pavement Rehabilitation/Replacement | 0.40 | 0.40 | 0.39 | 0.39 | 0.38 | 0.38 | 0.38 | 0.37 | 0.37 | 0.37 |
| Pavement Preventive Maintenance | 1.00 | 0.99 | 0.98 | 0.97 | 0.96 | 0.95 | 0.94 | 0.93 | 0.92 | 0.91 |
| Bridges | 0.90 | 0.89 | 0.88 | 0.87 | 0.86 | 0.86 | 0.85 | 0.84 | 0.83 | 0.82 |
| Preventive Maintenance/Preservation | 0.90 | 0.89 | 0.88 | 0.87 | 0.86 | 0.86 | 0.85 | 0.84 | 0.83 | 0.82 |
| Sub and Superstructures | 0.87 | 0.86 | 0.85 | 0.84 | 0.84 | 0.83 | 0.82 | 0.81 | 0.80 | 0.79 |
| Decks | 0.89 | 0.88 | 0.88 | 0.87 | 0.86 | 0.85 | 0.84 | 0.83 | 0.82 | 0.82 |
| Painting | 1.00 | 0.99 | 0.98 | 0.97 | 0.96 | 0.95 | 0.94 | 0.93 | 0.92 | 0.91 |
| Maintenance | 0.95 | 0.94 | 0.93 | 0.92 | 0.91 | 0.90 | 0.89 | 0.89 | 0.88 | 0.87 |
| Guardrail | 0.95 | 0.94 | 0.93 | 0.92 | 0.91 | 0.90 | 0.89 | 0.89 | 0.88 | 0.87 |
| Pavement Markings | 0.95 | 0.94 | 0.93 | 0.92 | 0.91 | 0.90 | 0.89 | 0.89 | 0.88 | 0.87 |
| Drainage | 0.95 | 0.94 | 0.93 | 0.92 | 0.91 | 0.90 | 0.89 | 0.89 | 0.88 | 0.87 |
| Signage | 0.95 | 0.94 | 0.93 | 0.92 | 0.91 | 0.90 | 0.89 | 0.89 | 0.88 | 0.87 |
| Vegetation/Roadside | 0.95 | 0.94 | 0.93 | 0.92 | 0.91 | 0.90 | 0.89 | 0.89 | 0.88 | 0.87 |
| Pavement Surfaces | 0.95 | 0.94 | 0.93 | 0.92 | 0.91 | 0.90 | 0.89 | 0.89 | 0.88 | 0.87 |
| Overall ASI | 0.88 | 0.87 | 0.855 | 0.84 | 0.83 | 0.82 | 0.81 | 0.79 | 0.77 | 0.75 |
Both granularity and summarization are possible with an indicator such as the ASI and its related metrics. It translates diverse asset performance indicators into a common denominator of investment adequacy. The ASI and its related metrics can be summarized into one overarching metric for the entire network through a simple weighted average calculation. At the same time, summary tables such as Table 37 allow the drilling down into asset classes or even geographic regions to further clarify the impacts of underinvestment. The type of granularity displayed by the States examined in this report allow them to specify to policy makers which asset classes are underfunded, and what the long-term implications of that are likely to be. Likewise, the asset-class analysis those States displayed allows creation of Sustainability Ratios for individual asset classes that can add increased insight into understanding of highway asset condition trends.
| << Previous | Contents | Next >> |